Climate data for heat-adaptation studies: insights from Professor Mark New’s seminar

When it comes to climate and health research, data is everything. But not all datasets are created equal. That was the focus of our latest HeatNexus webinar, led by Professor Mark New, Director of the African Climate and Development Initiative (ACDI) at the University of Cape Town.
Professor New is a Research Chair at ACDI and Professor in the Department of Environmental and Geographical Science at UCT. His research focuses on climate change detection, attribution, impacts, and adaptation. He currently leads two climate and health initiatives: HABVIA, which implements heat adaptation intervention trials in low-income homes in South Africa and Ghana, and AFRIVERSE, which develops tools for climate-health attribution across Africa.
In this seminar, Professor New provided a clear and structured overview of the major data types used in climate-health modelling, particularly for temperature and humidity. His message was simple: know your data, understand its strengths and limitations, and choose what’s right for your context.
The four types of climate data you should know about
1. Weather station (MET) data
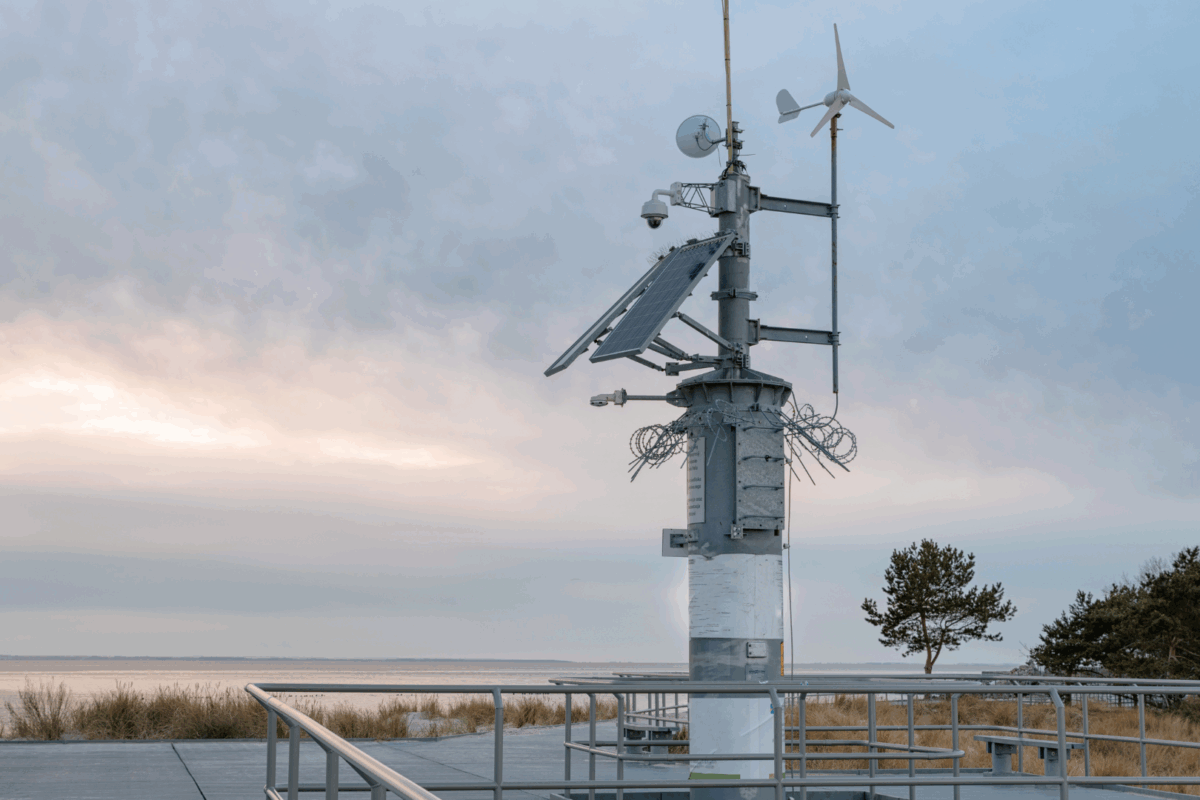
These are ground-based observations collected via manual or automated weather stations run by national MET services, research institutions, or private individuals.
Strengths:
- High accuracy and site-specific readings
- Often include long-term, continuous records
- Synoptic stations can capture multiple variables (e.g. wind, humidity, sunshine)
Limitations:
- Limited spatial coverage—each station only reflects its immediate surroundings
- Data quality may be impacted by site or instrument changes, requiring careful review of metadata and inhomogeneity testing
2. Gridded Station-based data
These datasets interpolate readings from weather stations across a regular grid, often using co-predictors such as elevation to improve estimates.
Strengths:
- Useful in regions with sparse station coverage
- Available across a range of temporal resolutions (monthly, dekad, daily)
- Enables spatially continuous analysis
Limitations:
- Accuracy decreases in areas with low station density
- Smoothing algorithms may under-represent extremes, especially at daily resolution
3. Satellite-based data
Satellite sensors detect radiation and use algorithms to estimate variables such as land surface temperature, humidity, and rainfall.
Strengths:
- Broad spatial coverage, including remote or hard-to-reach regions
- Valuable where ground station data are unavailable
Limitations:
- Indirect measurements introduce potential biases and inaccuracies
- Data may require averaging to address gaps or noise
- Not always directly comparable with ground-based air temperature readings
4. Reanalysis and climate models
These models utilise physics-based simulations to replicate climate conditions. Reanalysis datasets incorporate observational data to reconstruct past weather; climate models simulate future scenarios based on theoretical inputs.
Strengths:
- Provide large-scale, continuous datasets across time and space
- Useful when observations are limited or missing
- Helpful for scenario planning and long-term analysis
Limitations:
- As modelled data, they are subject to assumptions and parameterisation errors
- Reanalysis products may underestimate extreme heat, impacting heat-health assessments
- Not always suitable for hyper-local analysis without downscaling
Where to find climate data
Professor New highlighted several key portals for accessing climate datasets:
Copernicus Climate Data Store
These platforms offer a wide range of datasets from satellite products and reanalysis to station-based archives making it easier for researchers to find the data that best suits their project.
Bottom line?
There’s no one-size-fits-all dataset. Your choice depends on your research question, the spatial scale, and the type of analysis you want to conduct. Often, blending datasets gives you the best of both worlds.
Professor New’s key message was clear: understand your data, be transparent about its limitations, and choose tools that match the context you’re working in. Whether you’re modelling long-term exposure, tracking daily extremes, or planning for future climate risks, how you select and apply data can significantly shape your results.
Want to stay involved?
Follow HeatNexus for future seminars and tools supporting heat adaptation research.